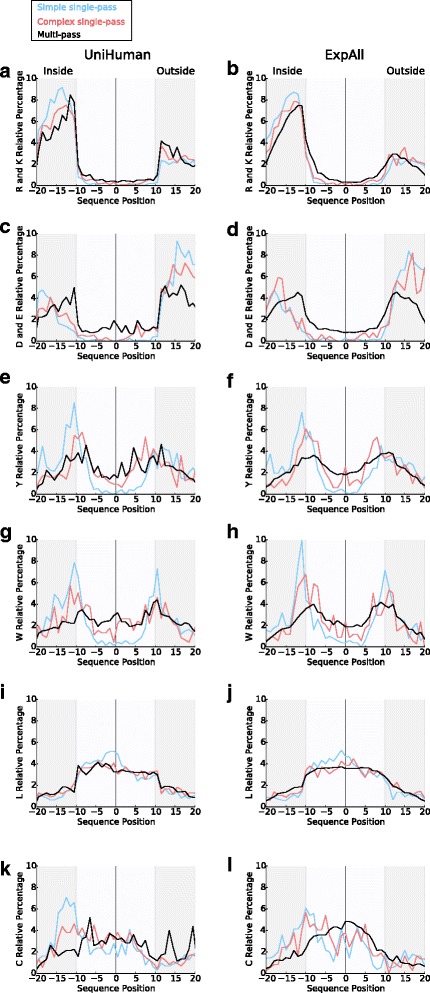
Fig. 7.

Comparing the amino acid relative percentage distributions of simple and complex TMHs from single-pass proteins and TMHs from multi-pass proteins. TMSOC was used to calculate which single-pass TMHs were complex and which were simple from ExpAll and UniHuman datasets. Simple TMHs are typically anchors without necessarily having other functions (Wong et al. [5]). The relative percentages from single-pass simple (shown in light blue), single-pass complex (red), and multi-pass protein TMHs (black) were plotted for (a, c, e, g, i and k) UniHuman and (b, d, f, h, j and l) ExpAll for (a and b) positive residues, (c and d) negative residues, (e and f) tyrosine, (g and h) tryptophan, (i and j) leucine and (k and l) cysteine. The slopes are statistically compared in Tables 5 and 6, and as a trend, the profiles of complex TMHs are more similar to multi-pass TMH profiles than simple TMHs are to multi-pass TMHs
