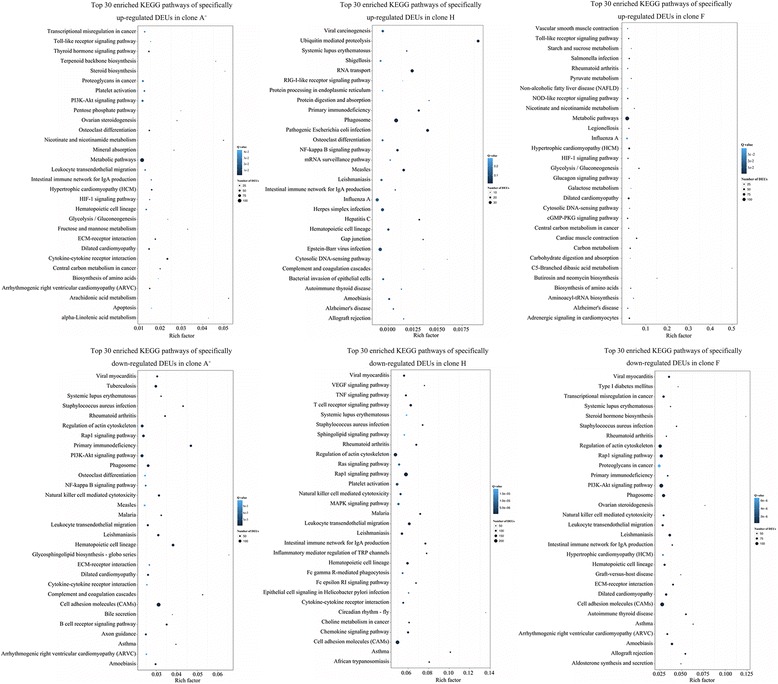
Fig. 5.

KEGG pathway enrichment analysis of unique DEUs in clone A+, H or F, respectively. Top 30 enriched KEGG pathways of specifically up- or down-regulated DEUs in clone A+, H or F. The x-axis indicates the rich factor of each pathway. The color and size of dot indicates Q value and the number of DEUs assigned to the corresponding pathway respectively
