
Fig. 7.
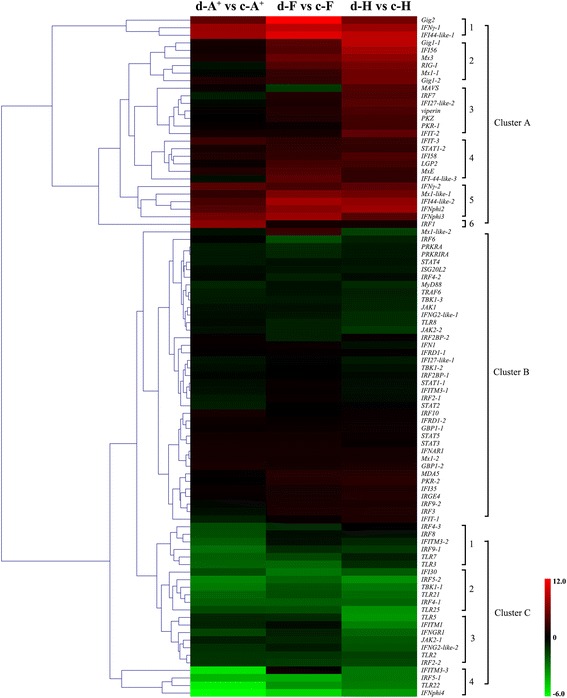
Heatmap of IFN system genes. Hierarchical clustering is calculated by log2 fold change values and the main clusters are lined out on the right. Up-regulated DEUs are shown in red and down-regulated DEUs in green
Official websites use .gov
A
.gov website belongs to an official
government organization in the United States.
Secure .gov websites use HTTPS
A lock (
) or https:// means you've safely
connected to the .gov website. Share sensitive
information only on official, secure websites.
Heatmap of IFN system genes. Hierarchical clustering is calculated by log2 fold change values and the main clusters are lined out on the right. Up-regulated DEUs are shown in red and down-regulated DEUs in green