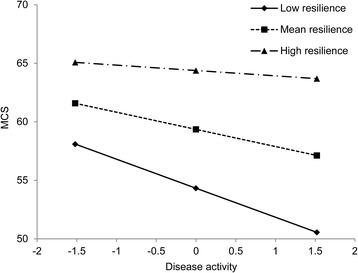
Fig. 1.

Simple slope plot of interaction between disease activity and resilience on MCS. Low, 1 SD below the mean; High, 1 SD above the mean. The values of disease activity and resilience were centered before regression analysis. The range of the centered value of disease activity is displayed. The mean and SD of the centered value of disease activity were 0 and 1.52, respectively. Gender, age, marital status, residence, anemia and EMS were adjusted. Abbreviations: MCS, mental component summary; SD, standard deviation; EMS, early morning stiffness
