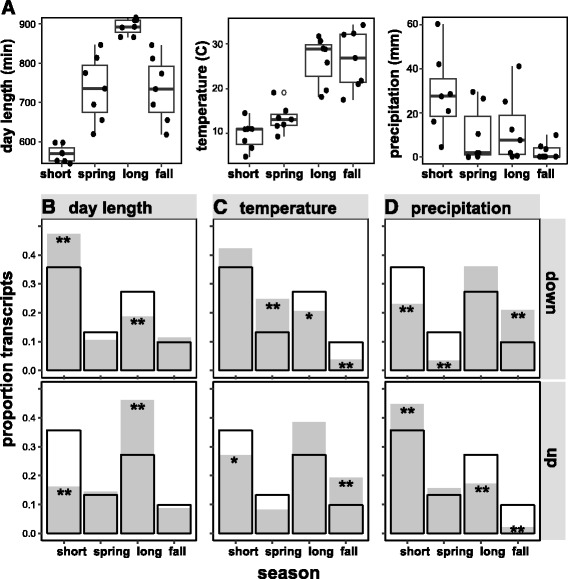
Fig. 6.

Seasonal distributions of phase times for environmentally-responsive transcripts identified in Hess et al. [33]. a Box plots show the mean and interquartile range for mean day length, mean maximum temperature, and cumulative precipitation for two-week intervals at our study site. These three environmental factors are predicted to influence transcription in Douglas-fir. b-d) Seasonal distributions of predicted and observed numbers of transcripts reaching maximum expression for each of the six environmentally-responsive classes identified in [33]. The predicted distribution (unfilled bars) represents the proportion of transcripts for each season reaching maximum expression (phase), across all environmentally responsive transcripts that show significant circannual cycles (N = 2278 transcripts). Observed distributions (filled bars) represent the proportion of transcripts for each season reaching maximum expression for each category (e.g., ‘day length-down’). Categories showing a significant excess or deficit of transcripts relative to expected proportions are identified by one or two asterisks (* = p ≤ 0.05; ** = p ≤ 0.01)
