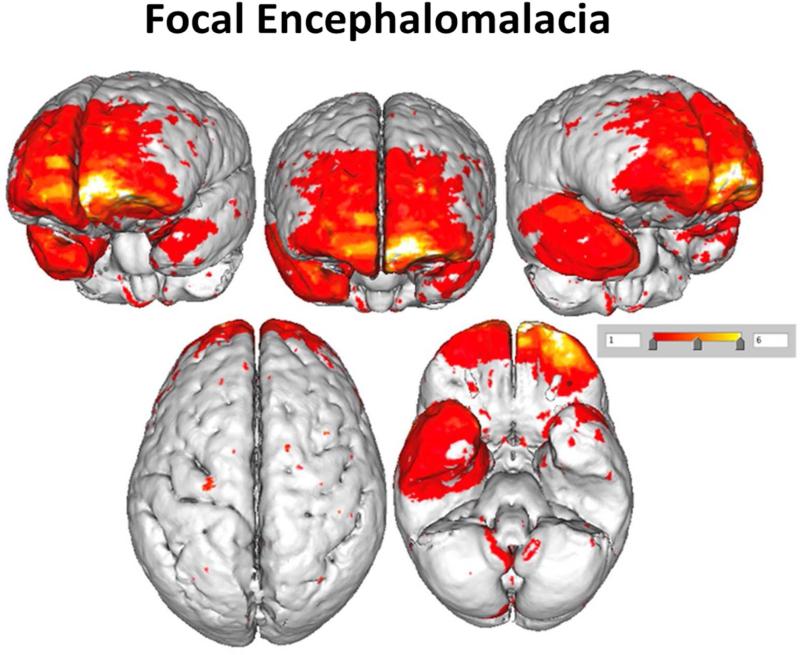
Figure 4.
This illustration plots where focal encephalomalacic changes occurred in TBI participants using a prototype brain image. No focal areas of encephalomalacia were identified in the OI controls. Note that the ‘heat map’ shows relatively few regions of overlap. Red depicts solitary areas of focal encephalomalacia that do not overlap with other participants, and overlap is depicted where the color is orange to white.

