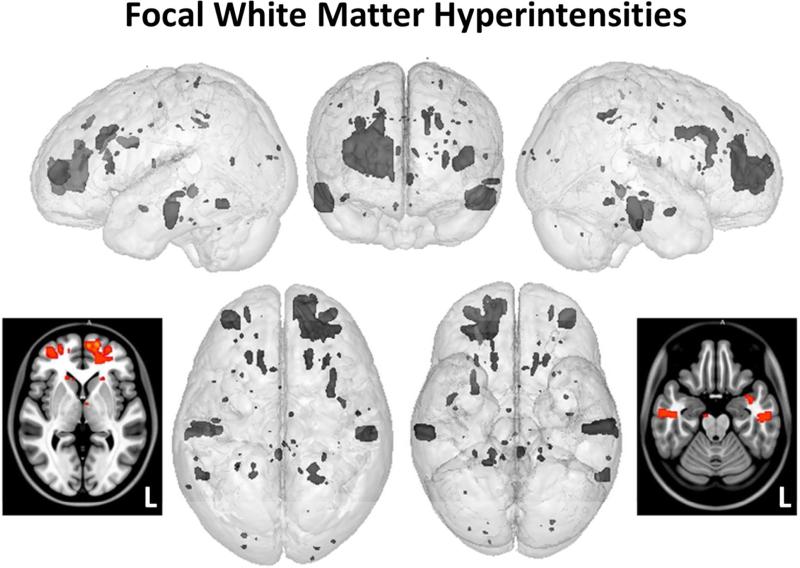
Figure 5.
Also using the same rendered prototype brain model as in Figure 3, but now spatially localizing where T2-FLAIR hyperintense signal abnormalities were identified, the loci of these areas were plotted. The axial smoothed renderings provide a ‘heat map’ (same scale as in Figure 3) identifying where overlap occurred, which was sparse and only in the left frontal lobe. Note – some of the hyperintense T2-FLAIR signal abnormalities occurred in predominantly subcortical gray matter structures, a less frequent location than within the white matter but nonetheless, known areas where hyperintense signal abnormalities may occur see 57, 58.

