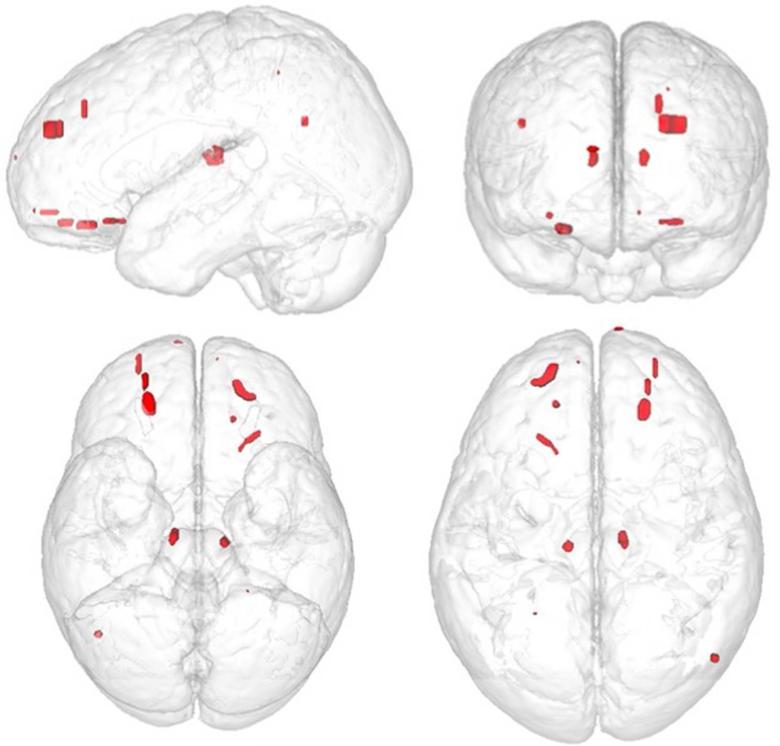
Figure 6.
Also using the same rendered prototype brain model as in Figure 3, but now spatially localizing where GRE hypointense signal abnormalities were identified, the loci of these areas were plotted. None overlapped and accordingly, only red is depicted.

