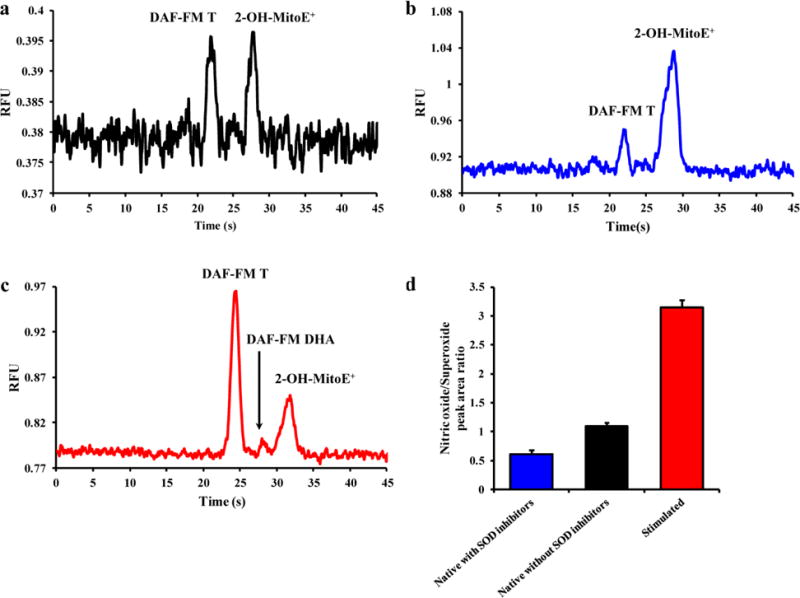
Fig. 2.

Representative electropherograms of (a) native macrophage cell lysate, (b) macrophage cell lysate treated with DDC and 2-ME, and (c) cell lysate stimulated with LPS + IFN-γ + PMA in the presence of SOD inhibitors. (d) A histogram comparing the NO/O2−• peak area ratios between unstimulated cells in the presence or absence of SOD inhibitors, and cells stimulated with LPS + IFN-γ + PMA in the presence of SOD inhibitors. Standard deviations are represented by vertical bars
