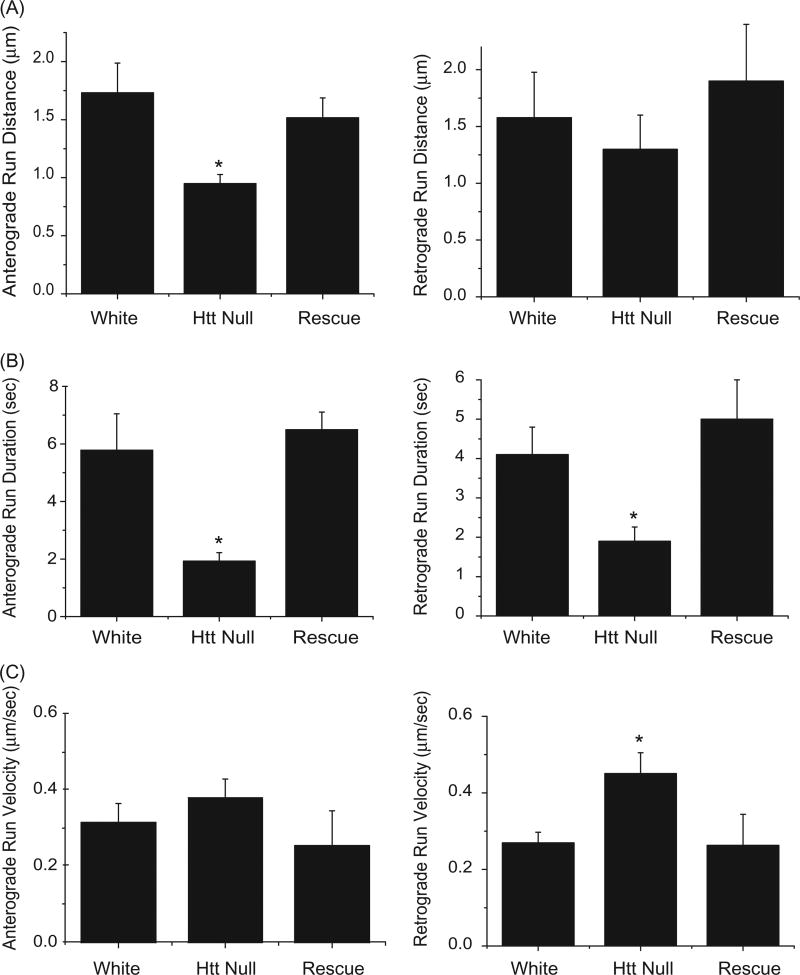
Figure 3.
FAT defects for mitochondria in dhtt−/− mutants. Run data was collected from individual mitochondria tracked in each one-second frame of a 300 image confocal time series. Tracks were used to calculate run distance, duration, and velocity for control white larvae, dhtt−/−, and dhtt−/− expressing a dhtt full-length rescue construct. Anterograde or retrograde designations reflect the imprinted or primary direction of movement. (A) dhtt−/− larvae exhibit a decrease in run distance for both anterograde and retrograde moving mitochondria. (B) dhtt−/− larvae exhibit a decrease in run duration for both anterograde and retrograde moving mitochondria. (C) dhtt−/− larvae exhibit an increase in velocity for retrograde moving mitochondria. Error bars represent SEM, *indicates p < 0.05.

