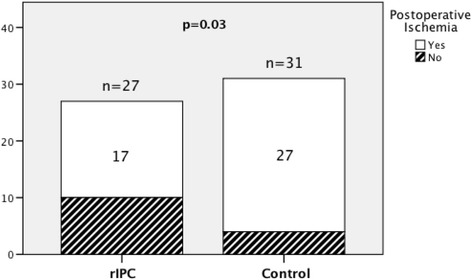
Fig. 3.

Ischemic preconditioning and postoperative ischemic lesions: the bar graph shows the incidence of new ischemic lesions in both treatment groups. The incidence of postoperative ischemic lesions was significantly higher in the control group (27/31) than in the rIPC group (17/27). Pearson chi-square test, p = 0.03
