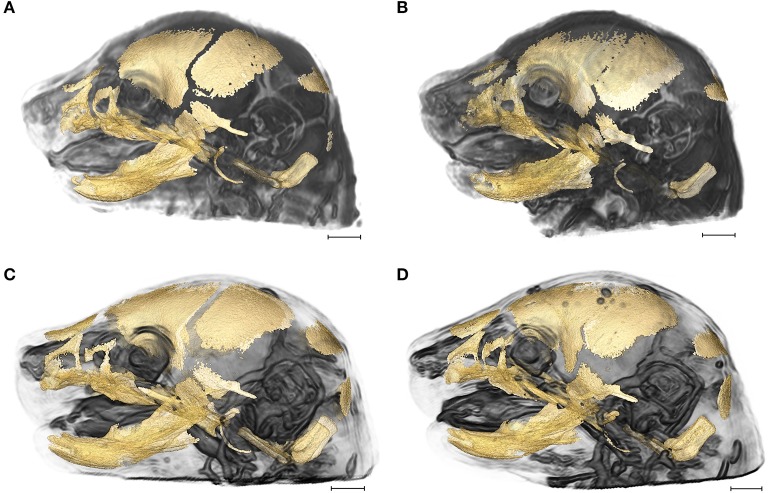
Figure 1.
3D reconstructions of high resolution HRμCT images of skull and HRMRM images of brain of E17.5 embryos superimposed to reveal structural associations. (A) Fgfr2+/+ unaffected littermate of the Apert syndrome mouse model; (B) Fgfr2+/S252W Apert syndrome mouse model; (C) Fgfr2c+/+ unaffected littermate of the Crouzon syndrome mouse model; (D) Fgfr2cC342Y/+ Crouzon syndrome mouse model. Scale bar = 1 mm. For details of image acquisition see Section Materials and Methods.

