Figure 3.
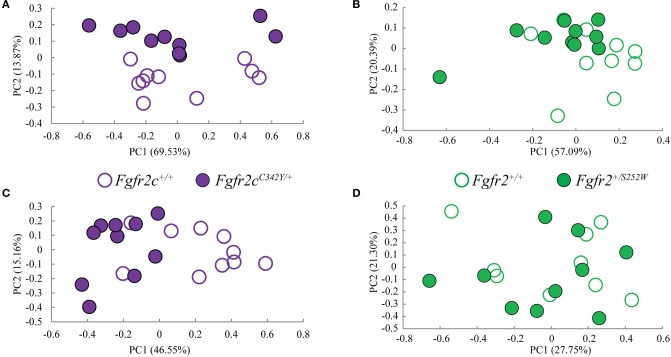
Results of PCA analyses of form based linear distances estimated among landmarks for skull and brain. (A,B) Scatter plots of individual scores based on PCA of skull form (shape + size). (A) Distribution of Fgfr2cC342Y/+ mutant mice and unaffected littermates (Fgfr2c+/+) along first and second Principal Components axes (PC1 and PC2) estimated using all unique linear distances among 10 cranial landmarks of each observation, scaled by the observation's geometric mean. (B) Distribution of Fgfr2+/S252W Apert syndrome mice and unaffected littermates (Fgfr+/+) along first and second Principal Components axes (PC1 and PC2) estimated using all unique linear distances among 10 cranial landmarks of each observation, scaled by the observation's geometric mean. (C,D) Scatter plots of individual scores based on PCA of brain form (shape + size). (C) Distribution of Fgfr2cC342Y/+ mutant mice and unaffected littermates (Fgfr2c+/+) along first and second Principal Components axes (PC1 and PC2) estimated using all unique linear distances among 10 brain landmarks of each observation, scaled by the observation's geometric mean. (D) Distribution of Fgfr2+/S252W Apert syndrome mice and unaffected littermates (Fgfr+/+) along first and second Principal Components axes (PC1 and PC2) estimated using all unique linear distances among 10 brain landmarks of each observation, scaled by the observation's geometric mean.

