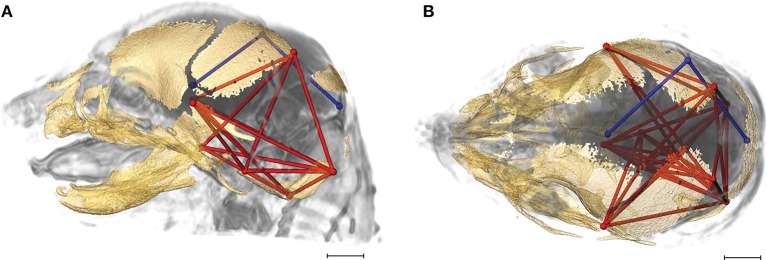
Figure 5.
Brain (in blue) and skull (in red) linear distances whose association was statistically significantly different between Fgfr2+/S252W Apert syndrome mice and Fgfr2+/+ unaffected littermates at E17.5 pictured on HRMRM and HRμCT reconstruction of a Fgfr2+/+ unaffected littermate (A, lateral view; B, superoinferior view). The two brain metrics (BR29 and BR34; see Supplementary Table 2) were in included in 71 of 139 (~51%) of the correlations that were significantly different between Fgfr2+/S252W Apert syndrome mice and Fgfr2+/S252W Apert syndrome mice and Fgfr2+/+ unaffected littermates. Scale bar = 1 mm.

