Figure 7.
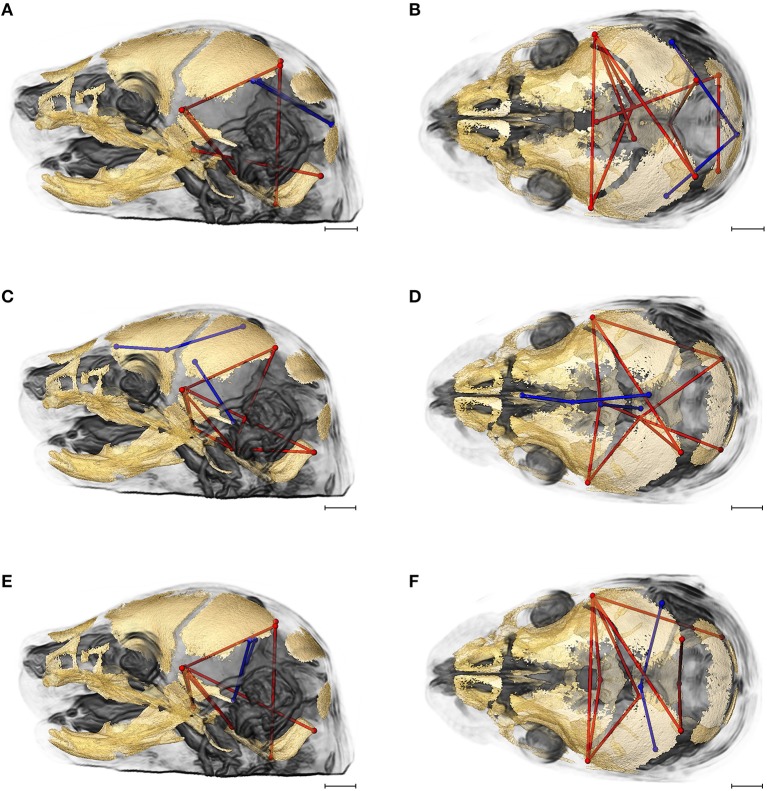
Brain (in blue) and skull (in red) linear distances whose associations were statistically significantly different between Fgfr2c+/+ and Fgfr2+/+ mice at E17.5 pictured on HRMRM and HRμCT reconstruction of a Fgfr2c+/+ mouse (A, lateral view; B, superoinferior view). (A,B) Two brain metrics [blue lines, BR15 (lpol&midcb) and BR34 (rpol&midcb) whose correlation with the skull metrics (red lines) were included in in ~14% of significantly different correlations in the two mutant mouse models]. (C,D) Three brain linear distances representing metrics associated with the corpus callosum BR39 (spcc&gcc), BR18 (obnp&gcc), BR1 (aptc&ac) are shown in blue. These brain metrics were involved in 10% of the total significant differences in correlations with specific skull measures (shown in red). (E,F) Two brain linear distances, BR30 (rpol&aptc) and BR8 (lpol&aptc) (in blue) were involved in an additional 5.60% of brain-skull correlations that were significantly different between CD1 and B6 mice. Skull linear distances are shown in red. The linesets represented in (A–F) represent nearly 30% of the correlations between brain and skull that were significantly different between CD1 and B6 mice. Scale bar = 1 mm.

