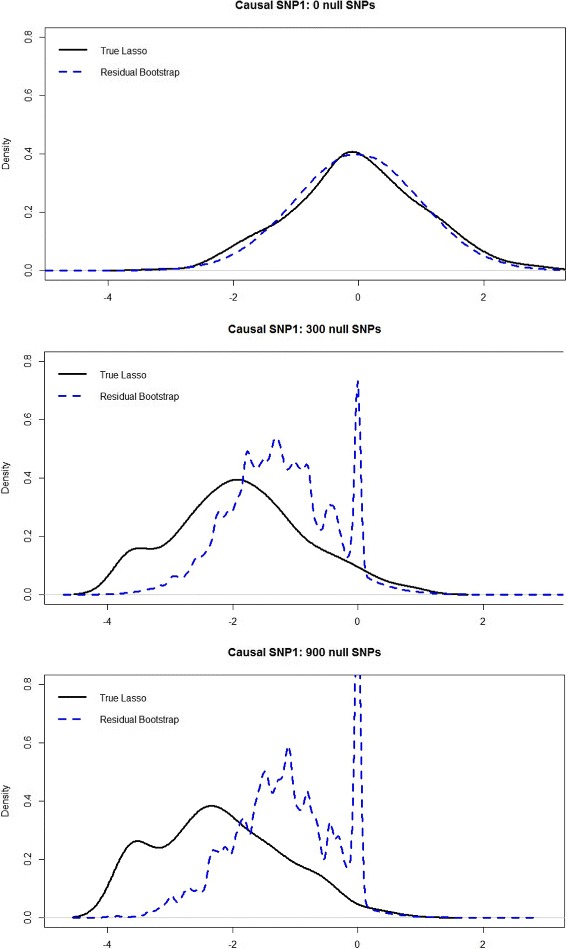
Fig. 1.

Comparison of the true Lasso distribution with the residual bootstrap approximation of the Lasso distribution. The black curve represents the empirical “true” Lasso distribution of , over 300 simulated datasets. The blue curve combines the residual bootstrap distribution of from all 300 datasets
