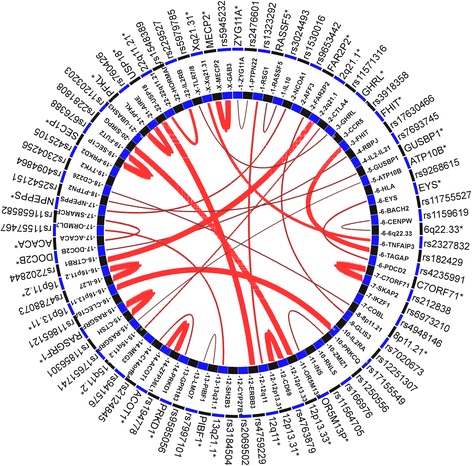
Fig. 2.

Distal regulatory elements and potential functional T1D SNPs in T1D susceptibility loci. The inner circle represents T1D susceptibility genes and genomic loci and the outer circle lists the regulatory variants and distal interaction regions. The distal interactive elements are denoted by an asterisk which includes enhancer elements and lncRNAs. The red lines indicate long-range chromosome interaction signals to another locus and the intensity of interaction is represented by the width of the red lines
