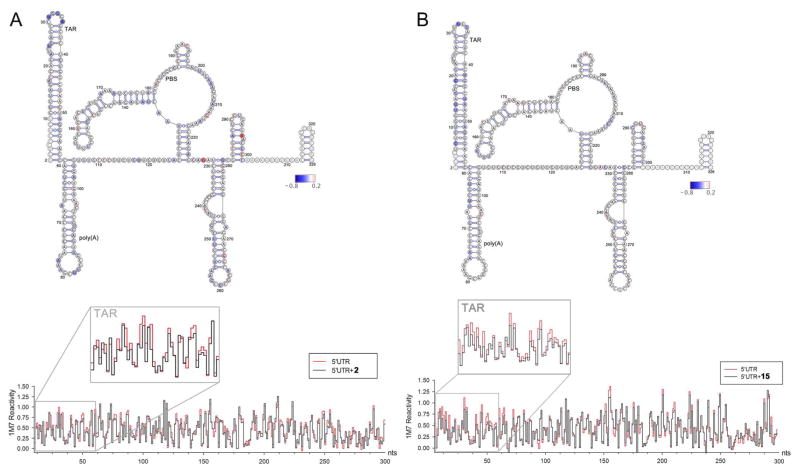
Figure 4.
SHAPE analysis of the HIV-1 5′ UTR in the presence of (A) 2 and (B) 15, respectively. top: nucleotides are color-coded according to normalized SHAPE reactivity values. 1M7 reactivity of the extreme 5′ and 3′ terminal nucleotides (represented in white) are not assigned due to limited resolution in the immediate vicinity of the primer and the final extension product. Nucleotide 1 is vector derived. bottom: step plots for quantitative comparison of 1M7 reactivity values obtained from the HIV-1 RNA 5′ UTR probed in the presence (black) or absence (red) of tested analog. Boxed region corresponds to nucleotides involved in formation of the 5′ TAR hairpin (nts G2–C58).

