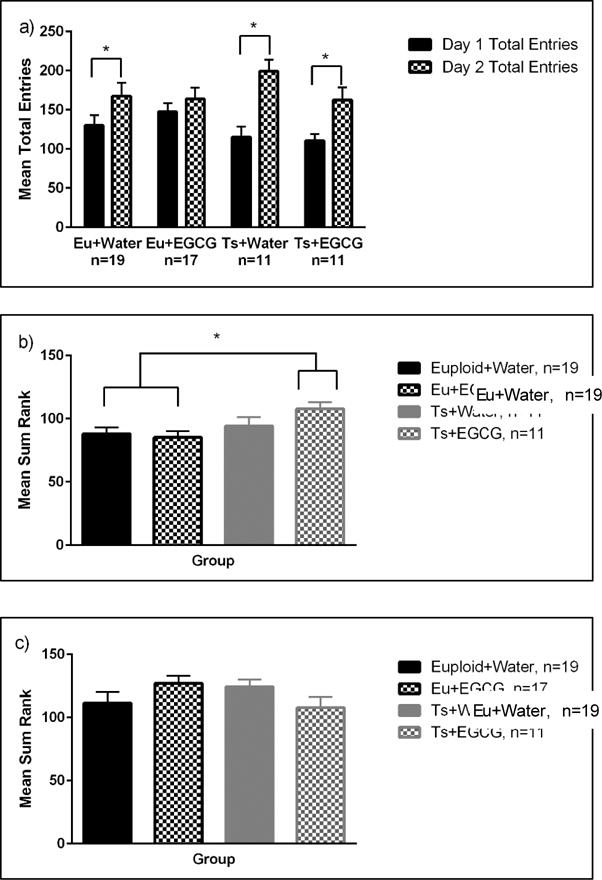
Figure 2.

a. MCSF Total Entries. Both Euploid (Eu) and Trisomic (Ts) mice increased the number of entries from Day 1 to Day 2. As indicated by (*), Eu+Water, Ts+Water, and Ts+EGCG groups had a significantly higher number of total entries on Day 2. Data are represented by mean ± SEM.
b. MCSF Risk Assessment Behavior. The Trisomic (Ts) mice exhibited higher risk assessment behavior than the Euploid (Eu) mice (data collapsed across both days). As indicated by the (*), the Ts+EGCG group displayed significantly higher risk assessment behavior compared to both euploid groups. Data are represented by mean ± SEM.
c. MCSF Risk Taking Behavior. There was a significant genotype × treatment interaction. Data are collapsed across days since there were no effects of day. Note that EGCG treatment had opposing effects on euploid and trisomic mice. Data are represented by mean ± SEM
