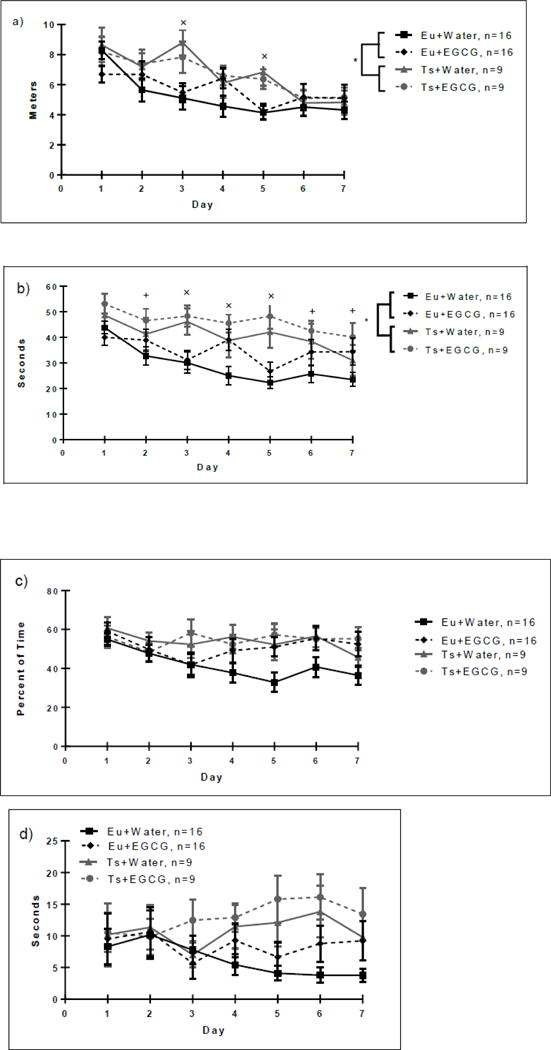
Figure 3.

a. MWM Acquisition Path Length. Acquisition in the Morris water maze spatial learning task by the Euploid (Eu) and Trisomic (Ts) groups. Each line represents the average path length (meters) for each acquisition day. All groups showed a decrease in latency over training days. However, trisomic mice of both treatment groups displayed higher path lengths versus the euploid groups (main effect of genotype, indicated by (*). Insert graph represents the total path length summed across all 7 acquisition days. Both trisomic groups exhibited increased total latency versus euploid-water controls (as indicated by the *). LSD post-hoc analysis revealed a significant increase in Trisomic + Water and Trisomic +EGCG latencies as compared to Euploid + Water mice (as indicated by the ×). Data are represented as mean ± SEM.
b. MWM Acquisition Latency. Seconds spent locating the hidden platform by the Euploid (Eu) and Trisomic (Ts) groups. Each line represents the average time (latency) to find the hidden platform for each training day. All groups showed significant reductions in latencies over days (main effect of day). However, trisomic mice were significantly impaired versus controls (day × genotype interaction, p=0.041). LSD post-hoc analysis revealed a significant increase in Trisomic + Water and Trisomic +EGCG latencies as compared to Euploid + Water (as indicated by the ×), or increases in Trisomic + EGCG latencies versus Euploid + Water mice (as indicated by the +). Data are represented as mean ± SEM.
c. MWM Acquisition Thigmotaxic Behavior. Percent of time spent in thigmotaxis (within 25.4 cm of the wall) by the Euploid (Eu) and Trisomic (Ts) groups. Each line represents the average percent of time for each acquisition day. There was an overall decrease in thigmotaxic behavior over training days, most evident in the Euploid-water group; however, mice receiving EGCG displayed higher thigmotaxis versus the water groups (main effect of treatment, p=0.039), due mainly to the increased thigmotaxic behavior of the Euploid-EGCG group relative to the euploid-water group. Data are represented as mean ± SEM.
d. MWM Acquisition Floating Behavior. Seconds spent floating by the Euploid (Eu) and Trisomic (Ts) groups. Each line represents the average time (seconds) floating for each acquisition day. Trisomic mice displayed significantly less reduction in floating behavior over days than the euploid mice (day × genotype interaction, p=0.017). Data are represented as mean ± SEM.
