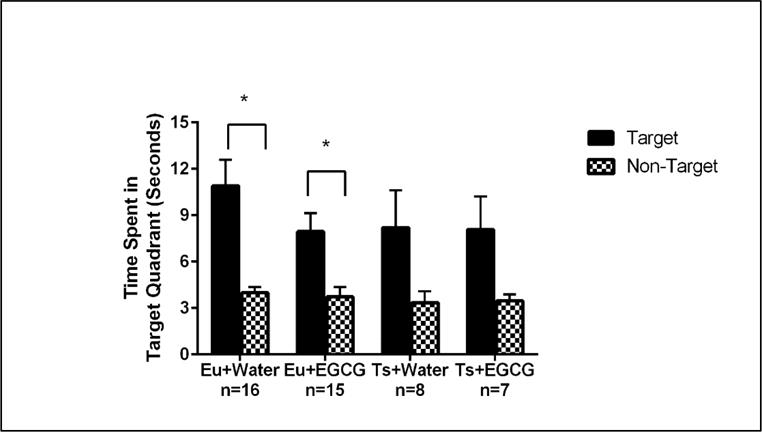
Figure 4. MWM Probe Trial.

Probe trial performance of Euploid (Eu) and Trisomic (Ts) mice of the two treatment groups on the probe trial (Day 8). The (*) comparing the Target and Non-target times of the euploid groups indicates a significant spatial bias for the Target location for both euploid groups ; the similar trend for the trisomic groups did not reach statistical significance. Bars represent the average time spent in the target and non-target quadrant, with error bars represented as SEM.
