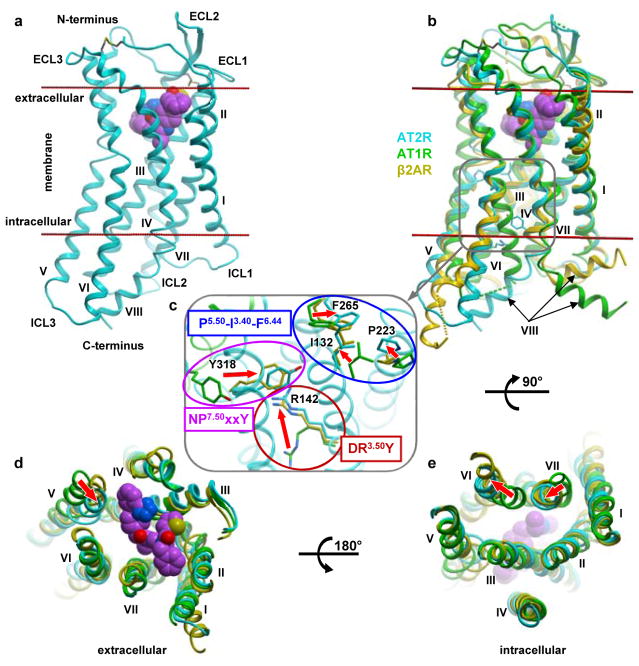
Figure 1. Active-like conformation of AT2R.
a, Overall receptor architecture. Cpd 1 is shown as spheres with carbon atoms in magenta, nitrogen in blue, oxygen in red, and sulfur in yellow. Membrane boundaries as defined by the OPM web server (www.opm.phar.umich.edu) are shown as red lines. b–e, Structural comparison of the active-like AT2R (cyan) with the inactive AT1R (green, PDB 4YAY), and active G protein-bound β2AR (yellow, PDB 3SN6) viewed from within the membrane (b), the extracellular side (d), and the intracellular side with helix VIII removed (e). The magnified region in (c) shows details of microswitches in the conserved motifs. The backbone of AT2R is shown in cyan cartoon, while distinct inactive position of AT1R helix VII is shown in green. Red arrows indicate conformational changes associated with receptor activation.

