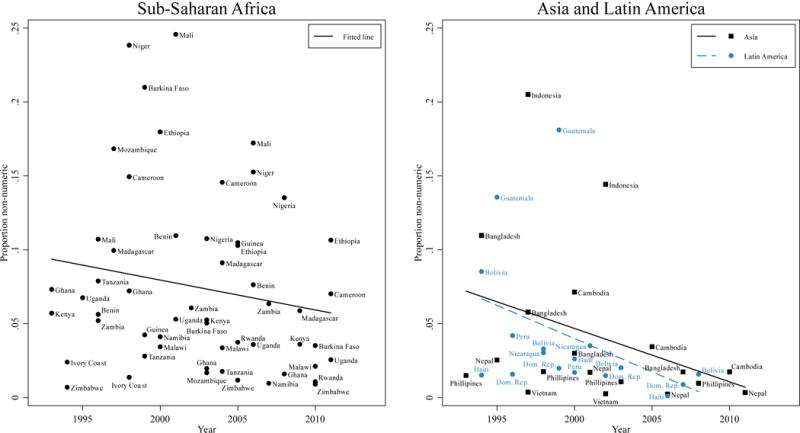
Figure 1.

Scatterplot of proportion of women providing a non-numeric response to the ideal family size question against year of survey.
Source: DHS implementing partners and ICF International. Demographic and Health Surveys 1993–2011.
Notes: Each dot represents one of the 91 DHS surveys included in our sample. Proportions are weighted to adjust for regional variation in sampling within countries. Surveys conducted in sub-Saharan Africa appear in the left-hand panel, and surveys conducted in Asia (black) and Latin America (blue) appear in the right-hand panel. Linear regression lines were calculated separately for each world region.
