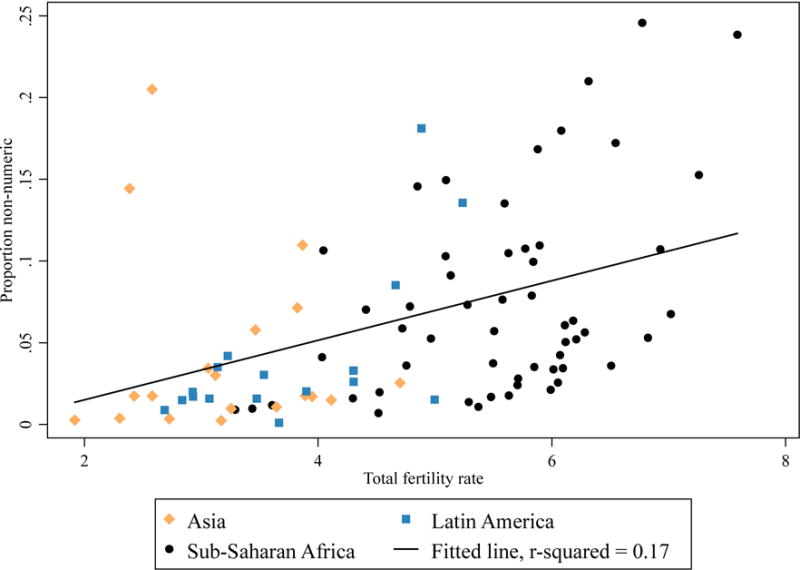
Figure 2.

Scatterplot of proportion of women providing a non-numeric response to the ideal family size question against total fertility rate for the year during which the majority of respondents were surveyed.
Source: As for Figure 1.
Notes: The two outlying points in the upper left corner are from Indonesia, which has unusually high levels of non-numeric response considering its fertility profile (see also Figure 3).
