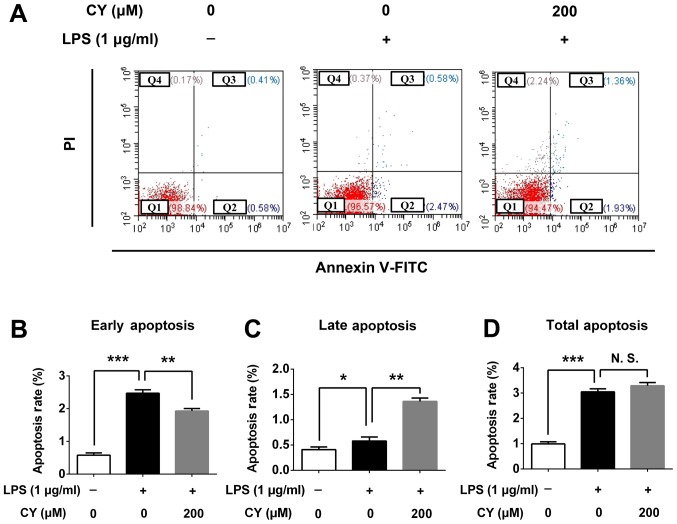
Figure 2.
Apoptosis assay of NP cells following CY treatment. (A) After stimulation with or without 1 µg/ml LPS and 200 µM CY for 24 h, cells were stained with Annexin V-FITC and Propidium iodide and the apoptosis rate was measured via flow cytometry. (B-D) The early, late and total apoptosis rate was calculated and compared. The data are presented as the means ± SD. ***P<0.001; **P<0.01; *P<0.05. All data were obtained from at least three independent experiments.

