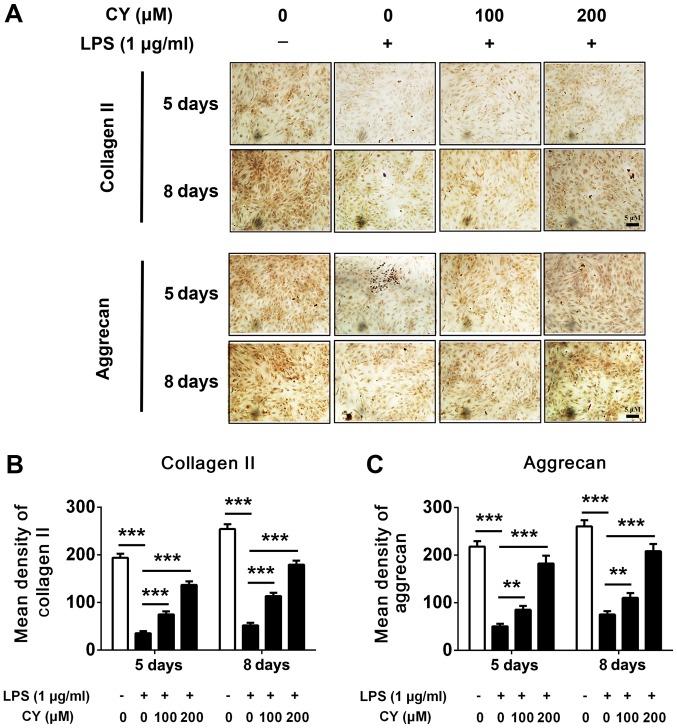
Figure 3.
Immunohistochemistry staining of NP cells after CY treatment. (A) 2×10⁴/ml cells were seeded in a 24-well plates, and these cells were cultured with different concentrations of CY and/or 1 µg/ml LPS for 5 or 8 days, then cells were fixed with 4% paraformaldehyde and performed immunohistochemistry staining of collagen II and aggrecan. (B and C) The immunohistochemistry staining of collagen II and aggrecan were quantified by integrated optical density (IOD). The data are presented as the means ± SD. ***P<0.001, **P<0.01. All data were obtained from at least three independent experiments.

