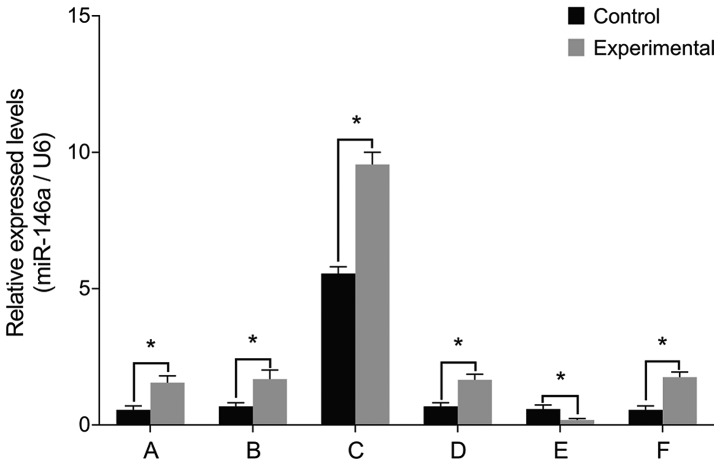
Figure 1.
miR-146a mRNA levels after cell transfection. (A) miR-146a level is higher in the experimental group than that in the control group before transfection. (B) miR-146a empty vector transfection. (C) miR-146a mimic transfection and miR-146a mRNA levels in the two groups of cells are increased 15-fold after treatment. (D) miR-146a mimic negative control transfection. (E) miR-146a inhibitor transfection and miR-146a mRNA levels in the two groups of cells are approximately decreased to 1/3 of previous levels after treatment. (F) miR-146a inhibitor negative control transfection. No differences were identified before and after treatment. miR, microRNA. *P<0.05.

