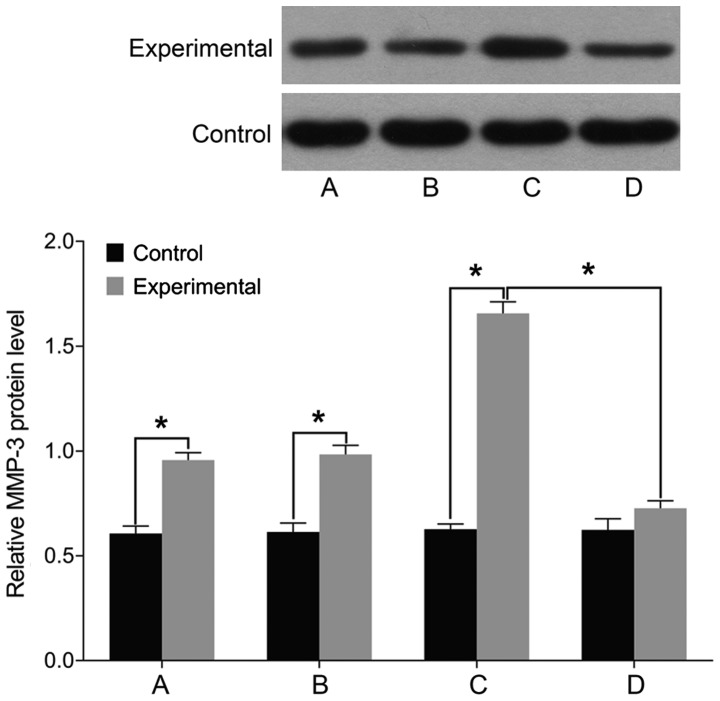
Figure 6.
Detection of cell MMP-3 levels using western blot analysis. (A) Before miR-146a transfection. (B) miR-146a empty vector transfection. (C) miR-146a mimic transfection. (D) miR-146a inhibitor transfection. A comparison of MMP-3 levels before and after treatment yielded no difference in the control group. The cell MMP-3 level is significantly higher in the experimental group than that in the control group before treatment. MMP-3 level is increased after treatment with miR-146a mimic in the experimental group, and is decreased after treatment with miR-146a inhibitor. MMP-3, matrix metalloproteinase; miR, microRNA. *P<0.05.

