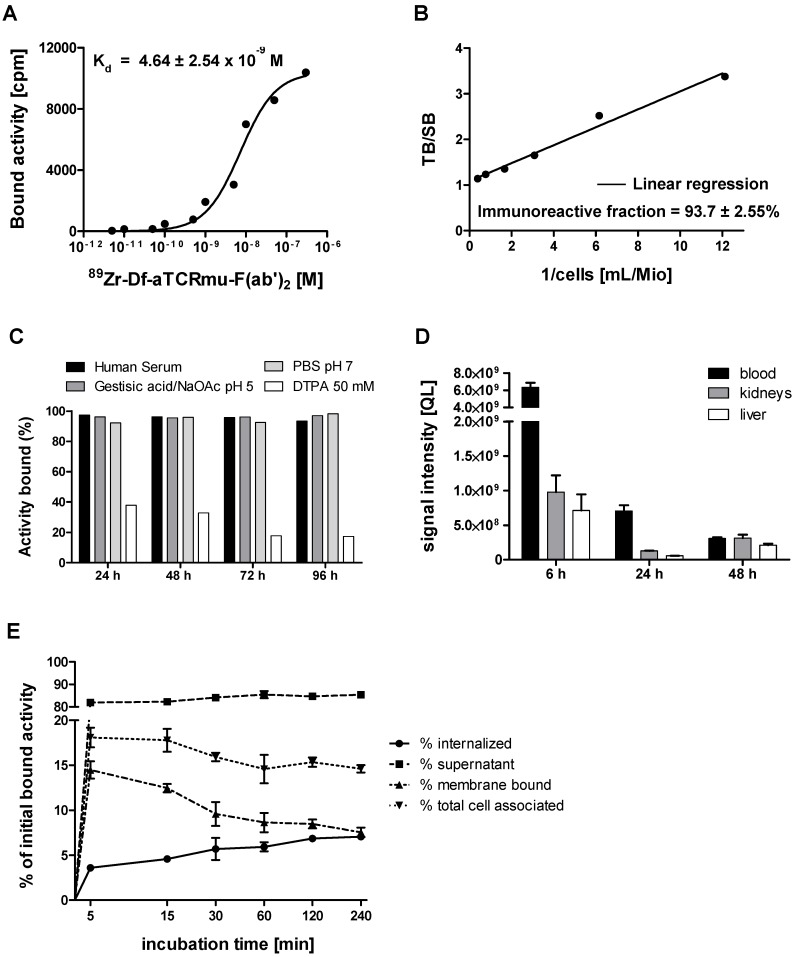
Figure 1.
In vitro and in vivo characterization of 89Zr-Df-aTCRmu-F(ab')2 (A) Determination of the dissociation constant (Kd) of 89Zr-Df-aTCRmu-F(ab')2 by saturation binding assays performed on TCR2.5D6 iRFP TCM. The Kd was calculated by non-linear regression analysis and is shown as mean ± SD. (n=4). (B) Determination of the immunoreactive fraction of the radiotracer using serial dilutions of TCR2.5D6-transduced Jurkat76 cells. The y-intercept of the linear regression yields the percentage of the immunoreactive fraction shown here as mean ± SD. (n=3). (C) In vitro evaluation of tracer stability in different media at indicated time points shown as percentage of bound activity after incubation. (D) In vivo stability analysis of the radiotracer post intravenous injection in NSG mice at defined time points (n=3) in blood, kidneys and liver. Organ suspensions were investigated by SDS-PAGE, for the presence of intact tracer. ROIs were drawn and the signal intensities were calculated and reported as quantum level values (QL). (E) Internalization assay of 89Zr-Df-aTCRmu-F(ab')2 in TCR2.5D6 iRFP TCM over 240 min. TCR2.5D6 iRFP TCM were incubated with 20 nM 89Zr-Df-aTCRmu-F(ab')2 for defined time points. Fractions representing unbound (supernatant), membrane bound and internalized activity were collected and are shown as percentage (%) of initially bound activity. Total cell associated activity is presented as sum of internalized and membrane bound radiotracer. Mean ± SD of triplicates are shown.

