Figure 3.
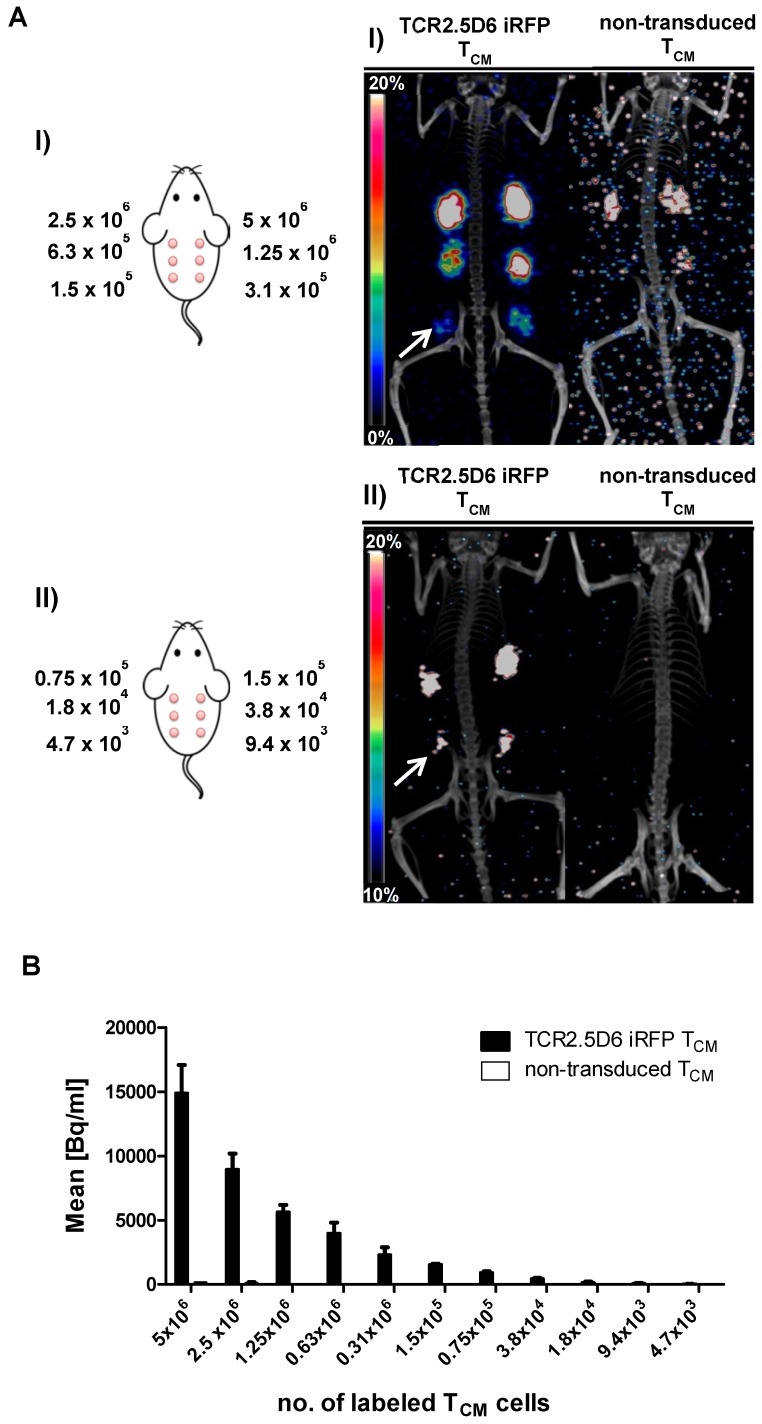
Detection limit assessment of in vitro89Zr-Df-aTCRmu-F(ab')2-labeled TCR2.5D6 iRFP TCM by small animal PET/CT (A) In vitro 89Zr-Df-aTCRmu-F(ab')2 labeled TCR2.5D6 iRFP TCM and non-transduced TCM were mixed with Matrigel™ and s.c. injected in mice using dilutions ranging from 5x10⁶ to 1.5x10⁵ (I) or 1.5x10⁵ to 4.7x10³ (II) labeled TCR2.5D6 iRFP TCM and non-transduced TCM. The representative 3D-PET/CT Maximum Imaging Projection images (MIP) are shown at the scale 0-20% of injected dose per gram (%ID/g) for group I and 10-20% of %ID/g for group II to allow visualization of low dilutions without noise signal. The white arrows indicate the highest dilution of detectable TCR2.5D6 iRFP TCM in the respective groups. (B) Quantitative region of interest (ROI) analysis of the single injected cell spots, shown as mean activity (Bq/ml) ± SD. (A-B) One representative image of mice injected with labeled TCR2.5D6 iRFP TCM (n=3) for group (I) and group (II) and for non-transduced TCM (n=2) for both groups is shown. Data of one out of two experiments are shown for both groups.

