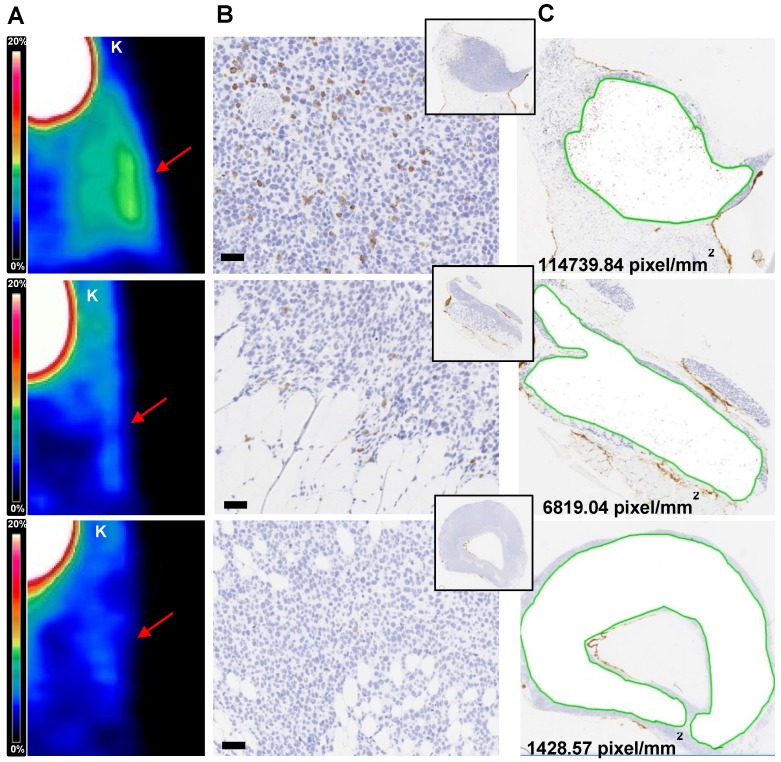
Figure 6.
Immunohistochemical analysis of TCR2.5D6 iRFP TCM infiltrated ML2-B7 tumors Quantitative IHC analysis of TCR2.5D6 iRFP TCM infiltrated ML2-B7 tumors after PET/CT imaging. (A) Representative 3D-PET (MIP) images of ML2-B7 tumors (n=3) with different infiltration rates and (B) corresponding IHC for CD3. Red arrows in the 3D PET-images indicate the ML2-B7 tumors. (C) Quantitative analysis of positive CD3 positive pixel based on the tissue area from the CD3 stainings. Magnification 20X, scale bar equals to 50 µm. PET scale bar 0-20 %ID/g. K=kidney.

