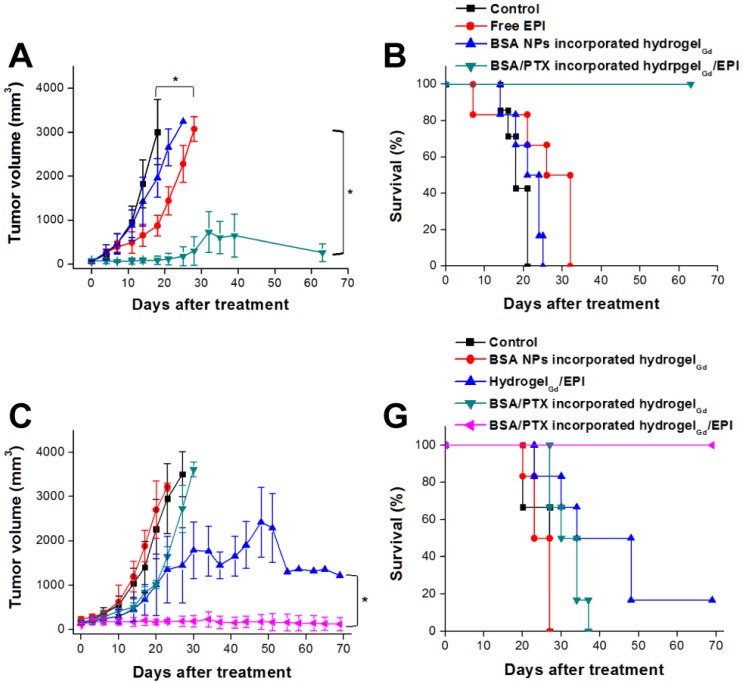
Figure 6.
(A) Tumor growth curves of mice bearing MBR 614 tumors after surgical operation then treatment with free EPI (i.v. injection) or BSA NPsincorporated hydrogelGd implantation or BSA/PTX NPs incorporated hydrogelGd/EPI implantation. Values are the means ± S.D. (n = 6). (B) Survival curves of mice bearing MBR 641 tumors after different treatments. Values are the means ± S.D. (n = 6). (C) Tumor growth curves of mice bearing U87 tumors after surgical operation then treatment with BSA NPs incorporated hydrogelGd or hydrogelGd/EPI or BSA/PTX NPs incorporated hydrogelGd or BSA/PTX NPs incorporated hydrogelGd/EPI implantation. Values are the means ± S.D. (n = 6). (D) Survival curves of mice bearing U87 tumors after different treatments. Values are the means ± S.D. (n = 6).

