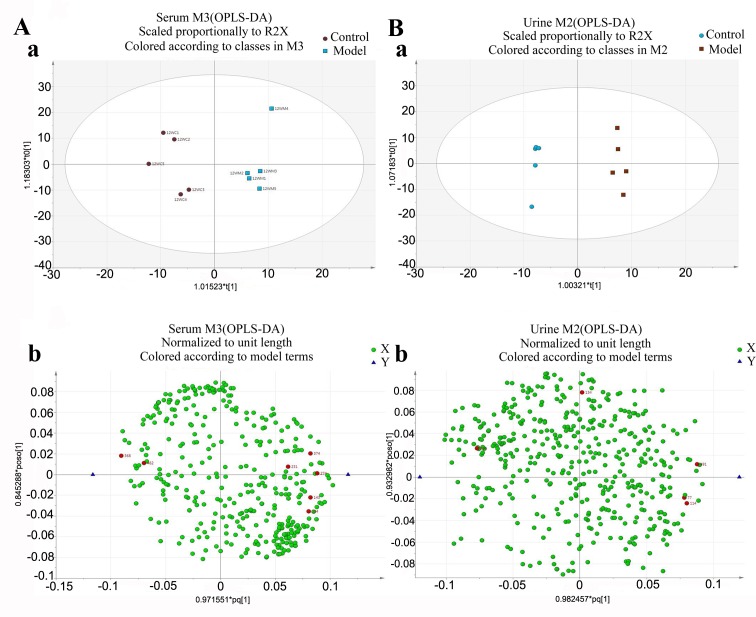
Figure 4.
OPLS-DA score plot of CCl4-liver fibrosis in rats serum and urine samples obtained from the two groups (control group, model group) at 12 weeks. Representative examples of (A) serum and (B) urine results. (Aa and Ba) These diagrams indicate that the model group had been separated from the control group. (Ab and Bb) Metabolic substances are represented as dots, red indicates the potential biomarkers. CCl4, carbon tetrachloride; OPLS-DA; Orthogonal projections to latent structures-discriminant analysis.

