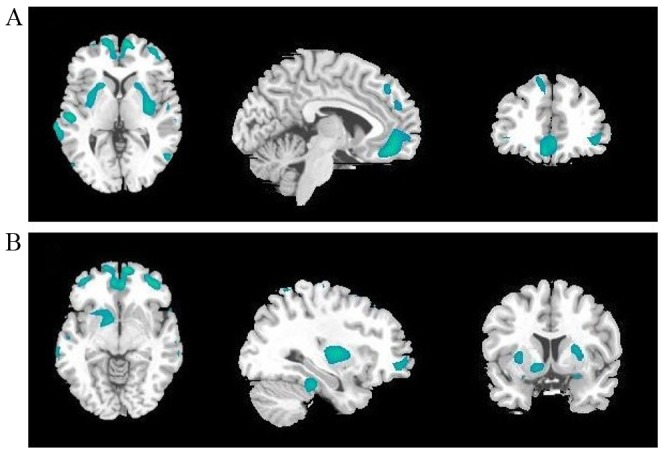
Figure 2.

Cerebral regions (green areas) with decreased regional glucose metabolism in patients with major depression disorder compared with controls (cluster-level corrected P<0.005). Left to right: Transverse, sagittal and coronal T1 magnetic resonance imaging. The highlighted cerebral regions are (A) the bilateral superior, middle and inferior frontal gyrus, bilateral superior and middle temporal gyrus, bilateral anterior cingulate cortex, bilateral putamen (B) the bilateral superior, middle and inferior frontal gyrus, bilateral anterior cingulate cortex, bilateral caudate, and the left pallidum.
