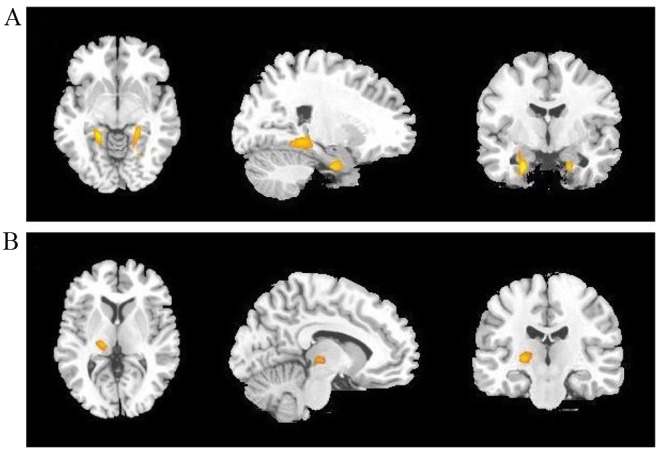
Figure 3.

Cerebral regions (yellow areas) with increased regional glucose metabolism in patients with major depression disorder compared with controls (cluster-level corrected P<0.005). Left to right: Transverse, sagittal and coronal T1 magnetic resonance imaging. Th highlighted cerebral regions are (A) the bilateral hippocampus and (B) the left thalamus.
