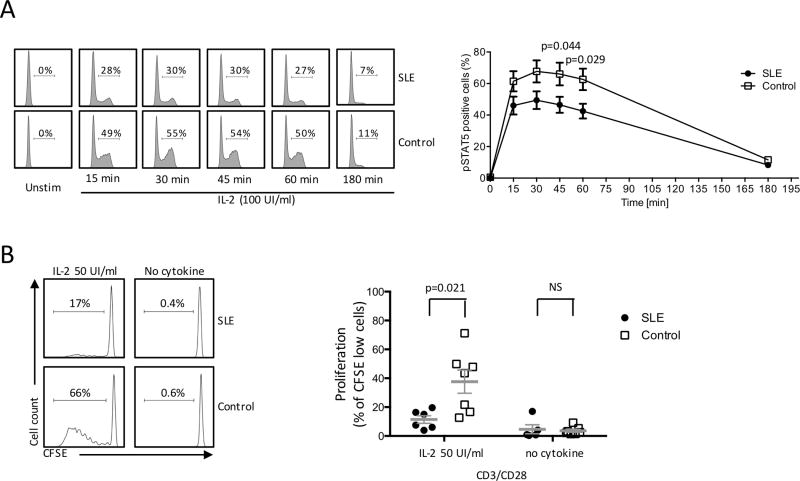
Figure 2. SLE CD4+ T cell response is impaired in SLE patients compared to healthy subjects.
CD4+ T cells from SLE and healthy controls were stimulated with IL-2. (A) pSTAT5 was assessed by flow cytometry at mentioned time points. Left panel: representative flow plot. Right panel: cumulative data (SLE n=8 and controls n=8). (B) CD4+ T cells isolated from SLE patients or controls were stimulated with anti-CD3/anti-CD28 with or without recombinant IL-2. Proliferation was expressed as CFSE-low cells. Left panel: representative flow plot. Right panel: cumulative data (SLE n=6 and controls n=7) (mean ± SEM).

