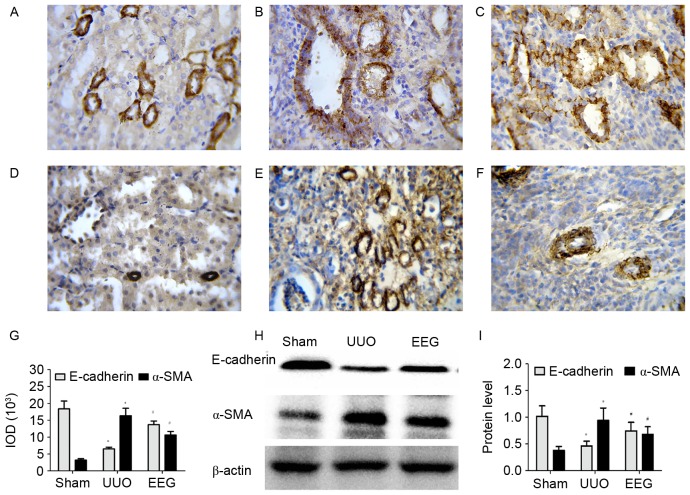
Figure 5.
Immunostaining and western blot analysis of E-cadherin and α-SMA. (A) E-cadherin staining was prominent in the sham group. (B) E-cadherin expression was weak in the UUO group. (C) E-cadherin expression was upregulated in the EEG group. (D) α-SMA was weakly detected in the sham group. (E) α-SMA was markedly increased in the UUO group. (F) α-SMA expression was suppressed in the EEG group. (G) The total IOD of E-cadherin and α-SMA in each group. (H and I) Western blot analysis of E-cadherin and α-SMA expression demonstrated similar trends as the immunohistochemistry findings. Images were captured at a magnification of ×400. Data are presented as the mean ± standard deviation (n=10). *P<0.05 vs. sham group; #P<0.05 vs. UUO group. α-SMA, α-smooth muscle actin; UUO, unilateral ureteral obstruction; EEG, ethanol extract of gardenia fruits; IOD, integrated optical density.

