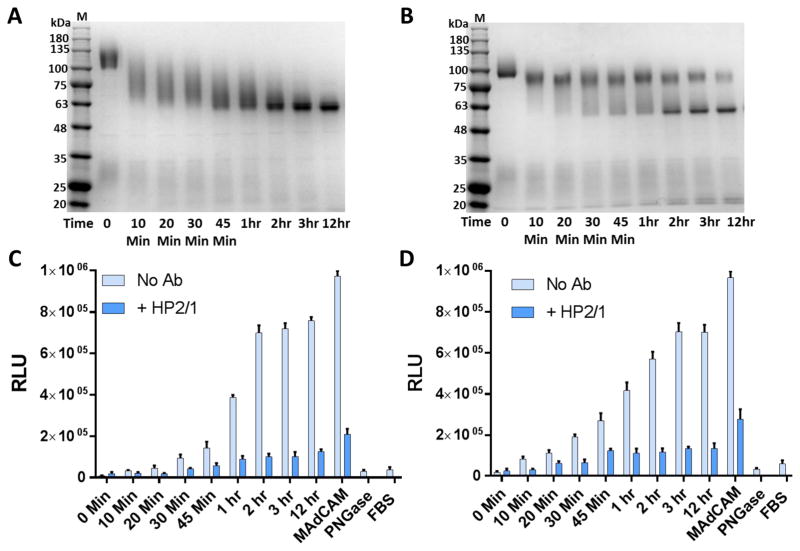
Fig. 7. Degree of deglycosylation correlates with α4β7 binding.
A and B, SDS-PAGE (4–20% gradient) analysis of FV40007 gp140 A, and JR-FL gp140 B. gp140 Env monomers were treated with PNGase for different time intervals (0 Min to 12 hr). C and D, Binding of α4β7 to FV40007 gp140 C, and JR-FL gp140 D after deglycosylation for the time intervals indicated in A and B. Lanes M represent molecular weight markers. α4β7 binding assays in the absence of mAb inhibitor (light blue bars) or in the presence of HP2/1 mAb (dark blue bars) were performed as described in the Fig. 3 legend. Data are shown as mean +/− SEM and are representative of at least three independent assays done in triplicate.

