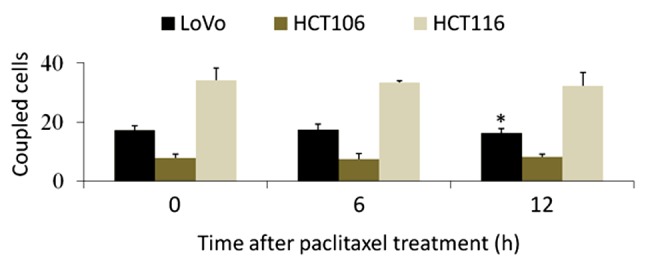
Figure 5.

Parachute dye-coupling analysis of gap junctional communication after different durations of paclitaxel treatment. The group with no treatment (0 h) was used as the control. Columns show the mean ± standard deviation from five independent experiments. *P<0.05 vs. 0 h.
