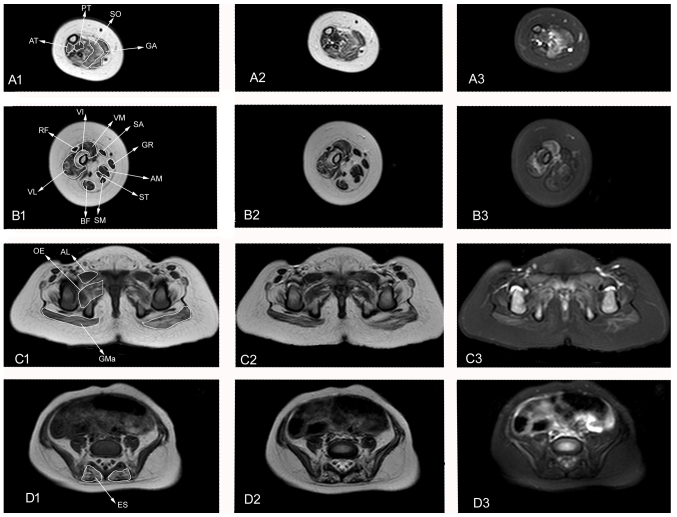
Figure 1.
Muscle MRI of the patient at 1 year of age. Axial T1WI, T2WI and T2WI SPAIR images of the lower leg, thigh and pelvis. (A) 1–3: Lower leg muscle MRI presenting PT, SO, GA, and AT fatty infiltration and edema. (B) 1–3: Thigh muscle MRI presenting VI, VM, VL, BF, AM, ST and SB atrophy and fatty infiltration. VM and VL present edema. (C) 1–3 and (D) 1–3: Pelvis muscle MRI presenting GMa atrophy (C1-3); GMa, OE and ES fatty infiltration (C1-3, D 1–3); and GMa, AL and OE edema (C1-3, D 1–3). MRI, magnetic resonance imaging; WI, weighted image; PT, posterior tibial; SO, soleus; GA, gastrocnemius; AT, anterior tibial; VI, vastus internus; VM, vastus medialis; SA, sartorius; GR, gracilis; AM, adductor magnus; ST, semitendinosus; SM, semimembranosus; BF, biceps femoris; VL, vastus lateralis; RF, rectus femoris; GMa, gluteus maximus; GP, greater psoas; OE, obturator externus; AL, adductor longus; ES, erector spinae.

