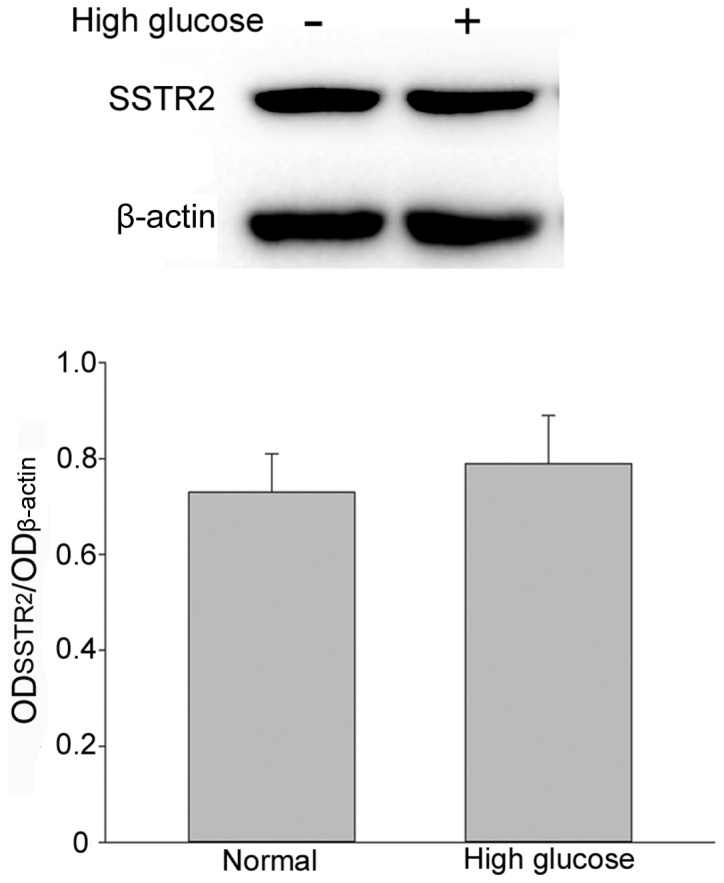
Figure 2.

Evaluation of SSTR2 expression under normal and high glucose conditions using western blot analysis and β-actin was used as the loading control. Each bar represents the mean + standard deviation of OD data from three samples. SSTR2, somatostatin receptor 2; OD, optical density.
