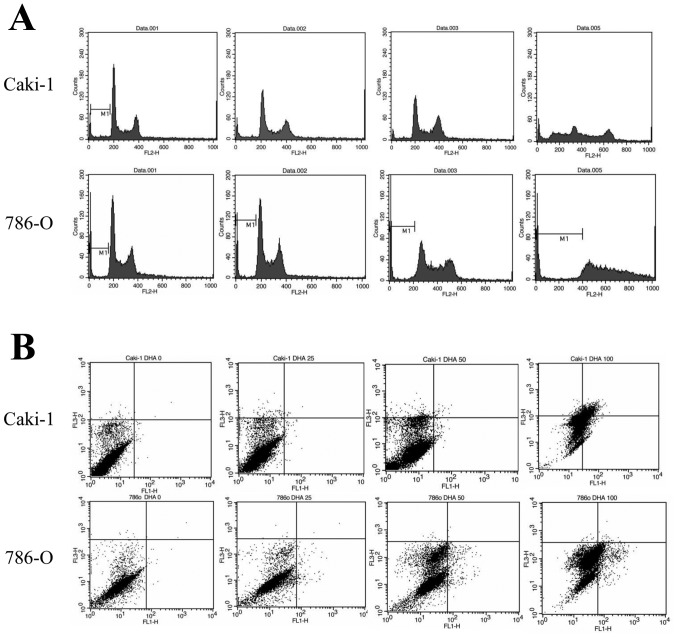
Figure 2.
Effects of DHA on cell cycle progression and apoptosis. (A) Cell cycle distribution of Caki-1 and 786-O cells treated with 0, 25, 50 and 100 µM DHA for 24 h. In both cell lines the population of cells in the sub-G1 phase was increased by DHA treatment (B) Annexin V/propidium iodide double-staining of Caki-1 and 786-O cells to determine rates of apoptosis following treatment with 0, 25, 50 and 100 µM DHA for 24 h. Cells that exhibited ` V-positive and propidium-iodide-negative staining (early apoptotic) are shown as a percentage on each graph. DHA, docosahexaenoic acid; Caki-1 and 786-O, renal cancer cell lines.

