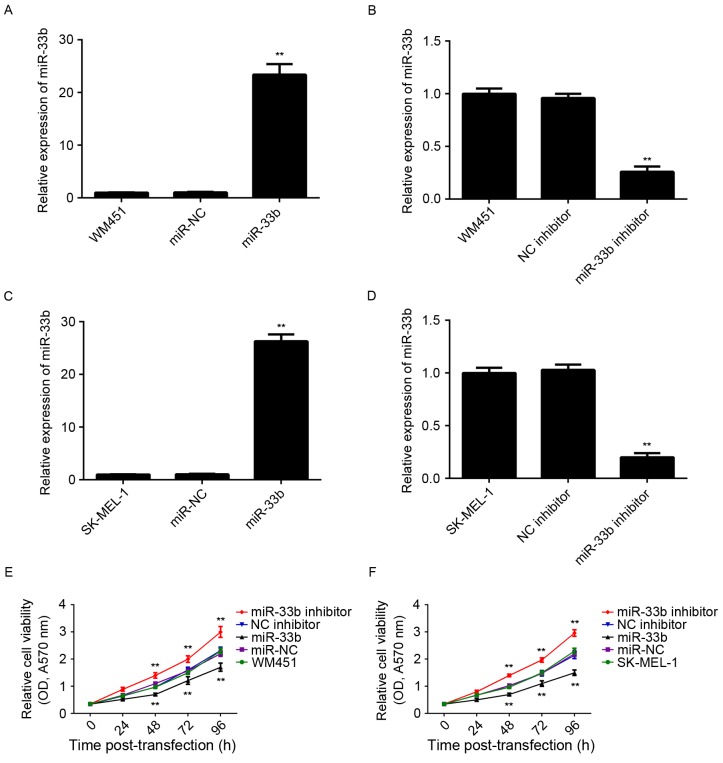
Figure 2.
Reverse transcription-quantitative polymerase chain reaction was conducted to examine miR-33b expression in WM451 and SK-MEL-1 MM cells. Levels of miR-33b expression in WM451 cells transfected with (A) miR-NC and miR-33b mimic, and (B) NC inhibitor and miR-33b inhibitor. Levels of miR-33b expression in SK-MEL-1 cells transfected with (C) miR-NC and miR-33b mimic, and (D) NC inhibitor and miR-33b inhibitor. Non-transfected WM451 or SK-MEL-1 cells were used as controls. Levels of expression were normalized to U6 gene expression. Data are expressed as the mean ± SD. An MTT assay was used to examine cell viability in (E) WM451 and (F) SK-MEL-1 cells. Data are presented as the mean ± SD. **P<0.01 vs. WM451 or SK-MEL-1 control. miR, microRNA; MM, malignant melanoma; miR-NC, scramble miR mimic; NC, negative control; OD, optical density; SD, standard deviation; A570 nm, absorbance at 570 nm.

