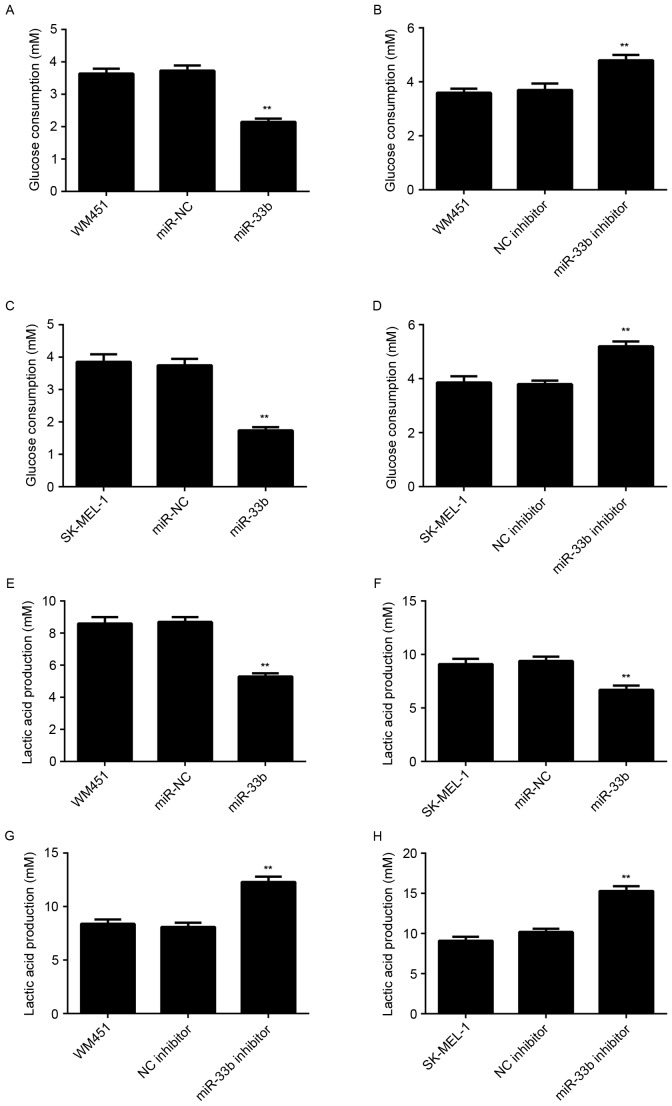
Figure 3.
Glucose consumption of WM451 cells transfected with (A) miR-NC and miR-33b mimic, and (B) NC inhibitor and miR-33b inhibitor. Glucose consumption of SK-MEL-1 cells transfected with (C) miR-NC and miR-33b mimic, and (D) NC inhibitor and miR-33b inhibitor. Lactic acid production of (E) WM451 and (F) SK-MEL-1 cells transfected with miR-NC and miR-33b mimic. Lactic acid production of (G) WM451 and (H) SK-MEL-1 cells transfected with NC inhibitor and miR-33b inhibitor. Non-transfected WM451 or SK-MEL-1 cells were used as controls. Data are presented as the mean ± standard deviation. **P<0.01 vs. WM451 or SK-MEL-1 control. miR, microRNA; miR-NC, scramble miR mimic; NC, negative control.

