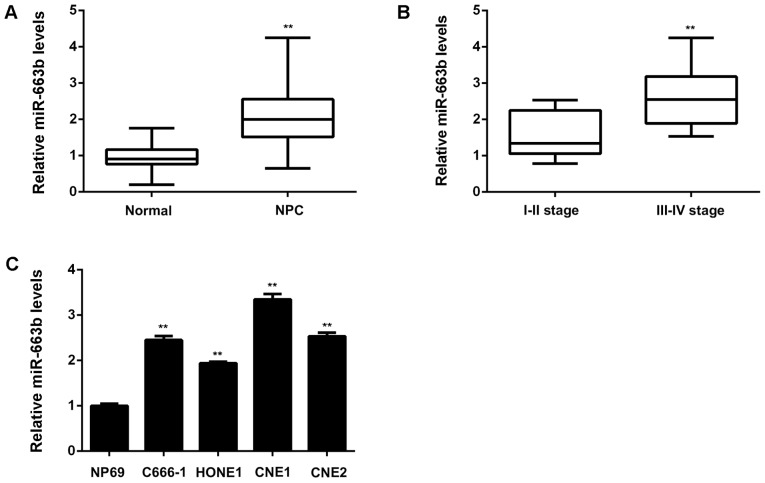
Figure 1.
(A) Quantitative PCR (qPCR) was conducted to examine the miR-663b levels in NPC tissues and non-tumor nasopharyngeal epithelial tissues. **P<0.01 vs. Non-tumor. (B) qPCR was conducted to examine the miR-663b levels in NPC with different stages. **P<0.01 vs. I–II stage. (C) qPCR was conducted to examine the miR-663b levels in NPC cell lines (C666-1, HONE1, CNE1, and CNE2) compared with a normal nasopharyngeal epithelial cell line NP69. **P<0.01 vs. NP69. NPC, nasopharyngeal carcinoma.

