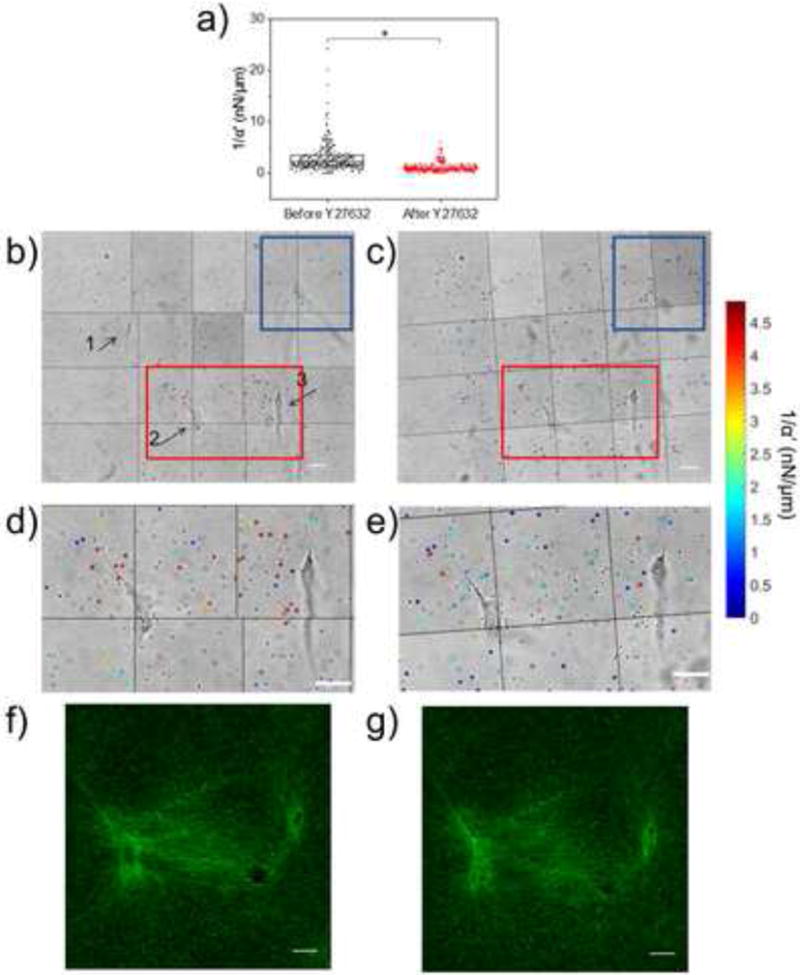
Figure 2.

Mapping pericellular stiffness with AMR. (a) Scatterplot of AMR measurements of 1/α′ in 2 mg/ml type I collagen gel around multiple HAoSMCs in a ~ 350 × 280 μm2 region taken before (nbeads = 288) and after (nbeads = 279) 1 hour incubation with 20 μM Y27632. 1/α′ values significantly decreased after treatment (p ≪ 0.001). Montage containing HAoSMCs (labeled 1, 2, and 3) and microbeads (represented in (a)) probed before (b) and after (c) treatment. Probed microbeads are overlaid with a colored circle corresponding to the measured 1/α′ (note color bar saturates at 5 nN/μm, but full range is shown in (a). (d, e) Zoomed in view of regions in (b) and (c) bound by red rectangle. (f, g) Reflection confocal images of region between cells 2 and 3 before and after treatment with Y27632. Scale bars are 20 μm.
