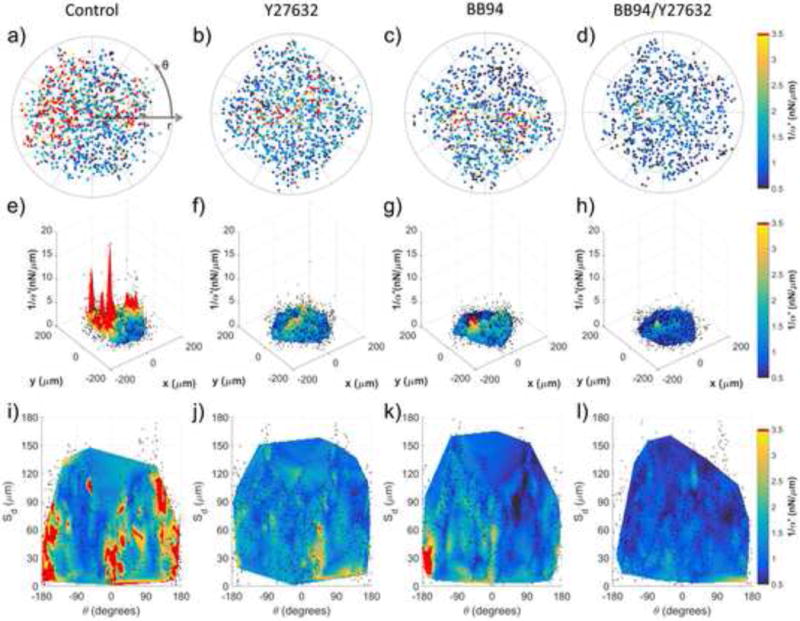
Figure 4.

Characterization of pericellular stiffness for multiple isolated DFs. Polar plots of 1/α′ surrounding isolated cells for (a) control (ncells = 3), (b) 20 μM Y27632 (ncells = 3), (c) 10 μM BB94 (ncells = 3) and (d) BB94+Y27632 (ncells = 3) conditions. Concentric lines are drawn in 50 μm increments of r. (e–h) 3D surface plots of the aggregate data in (ad), respectively. (i–l) Data in (a–d) mapped to a Cartesian plot of θ vs. distance from cell boundary, Sd. For (e–l), probed beads are denoted by black dots. Data interpolation is restricted to regions containing data from all cells, per condition. Color maps in (a–d and i–l) range approximately from the average 1/α′ value of BB94+Y27632 to the average 1/α′ value plus one standard deviation of the control condition. Note that the color map saturates at 3.5 nN/μm.
