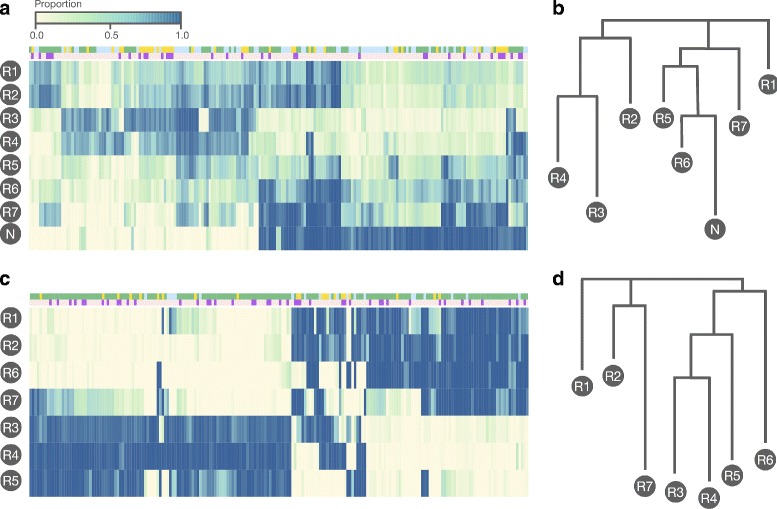
Fig. 4.

a Heatmap of the top 200 most variable epialleles across the seven tumour samples (labelled R1 to R7) and matched normal sample (labelled N). A proportion of 1.0 (dark blue) means that that epiallele accounted for all observed methylation patterns at the corresponding locus. These data have not been decontaminated of normal tissue. b The phylogenetic tree inferred before correction for contaminating normal tissue. In c and d are the same figures for the decontaminated epiallele profiles. In the top annotation track green denotes a CpG island, yellow a shore, and blue otherwise. In the bottom track dark purple denotes a gene promoter, otherwise light pink. A promoter was defined as between 2kb upstream and 50bp downstream from a transcription start site
