
Fig. 2.
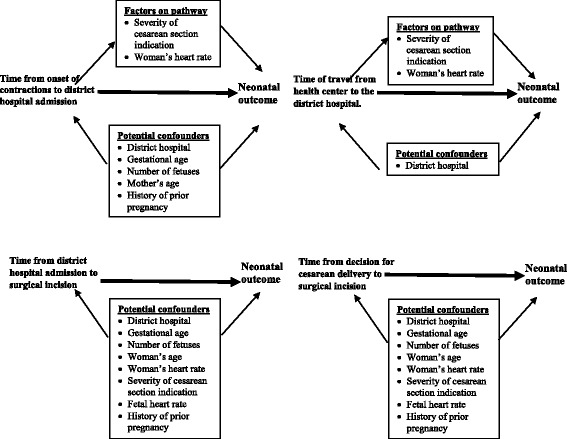
Directed acyclic graphs (DAGs) mapping the relationship between the four possible delays and neonatal outcomes, noting potential confounders
Official websites use .gov
A
.gov website belongs to an official
government organization in the United States.
Secure .gov websites use HTTPS
A lock (
) or https:// means you've safely
connected to the .gov website. Share sensitive
information only on official, secure websites.
Directed acyclic graphs (DAGs) mapping the relationship between the four possible delays and neonatal outcomes, noting potential confounders