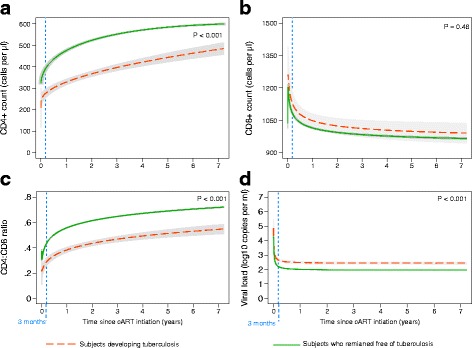
Fig. 3.

Immunological recovery since cART initiation among HIV-infected patients in the German ClinSurv HIV Cohort, 1999-2013. (a) Profile plot of CD4+ cell count. (b) Profile plot of CD8+ cell count. (c) Profile plot of CD4:CD8 ratio. (d) Profile plot of viral load. The best-fitting model of CD4+ cells count is FP2 (0, 0.5) for subjects who remained free of TB and is FP2 (−1,1) for subjects who developed TB. Irrespective to TB development, the best-fitting model of CD8+ cells count is FP2 (−0.5, −0.5)], of CD4:CD8 ratio is FP2 (−0.5, −0.5), and of viral load is FP2 (−2, −0.5). No measurements were included after TB diagnosis. TB: tuberculosis; FP2: second-degree fractional polynomial model
